And the reasons are obvious. It has increased organizational efficiency, global access, ease of use, better cash flow, reduced risks, and low investment without the hassles of maintenance. Cloud technology is a respite, especially to small and medium businesses. If you are running an online business, you are likely to host them on the cloud, and you need to monitor them to ensure their availability. When you are a service provider, you are required to keep a sharp eye on almost everything, specifically the things that can impact your service offerings that include your server health. It can be performance metrics, availability, network throughput, disk space, security patching, and a lot more. You must have full visibility over your entire software, servers, server logs, resource utilization, stack traces, network, and business processes. And this is why your business needs reliable server monitoring. To be specific, you need a cloud server monitoring solution because traditional monitoring may not fit the cloud environment. Besides, you would never like to welcome extra hassles of maintenance and cost associated with traditional monitoring. Hence, it’s better to go for a SaaS-based monitoring solution to keep an eye on your cloud servers because of:
Scalable infrastructure
Scalable infrastructure is a necessity for growing businesses. Instead of opting for a traditional system that does not give you this flexibility, consider taking cloud services. You can choose a suitable plan based on your expanding needs.
More flexibility
Cloud server monitoring allows multiple user access so they can work more closely and simultaneously. It boosts team collaboration, and they can see the changes reflecting in real-time no matter what device they use. With powerful integration, you can leverage many services, and you don’t have to keep emailing documents back and forth.
Remote workspace
Last year brought changes in the organizational lifestyle that people never dreamed of. It boosted location-independent work environments, communicated and collaborated via cloud services, and enabled conferences and projects to be completed online. This explains why cloud services are becoming popular when it comes to monitoring.
Cost-efficient 🤑
Budget is another constraint that SMBs deal with. But using a cloud solution, you can save a lot of your budget. You can pay for what you actually utilize, unlike traditional systems. All these points explain the efficacy of cloud solutions. Next, let’s look at some of the good server monitoring solutions for your business.
Dotcom-Monitor
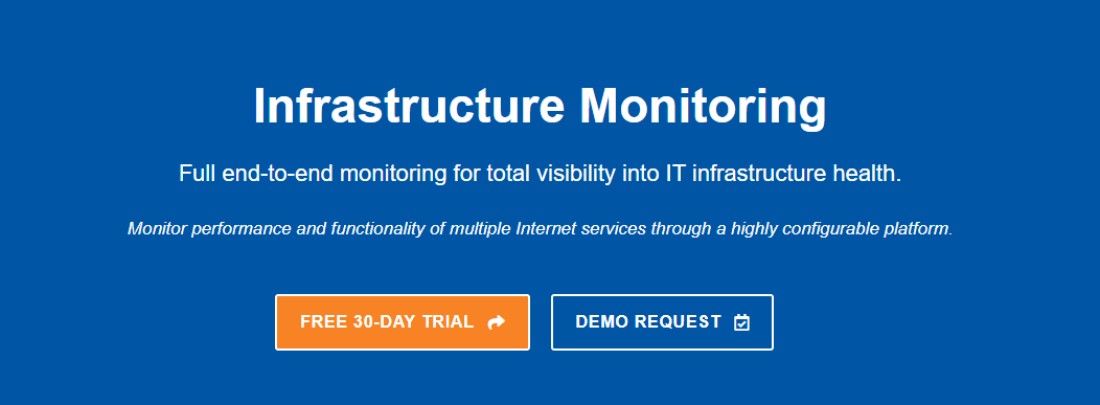
Dotcom-Monitor offers a complete end-to-end monitoring solution to get visibility into IT infrastructure health. It monitors the functionality and performance of various internet services via a configurable platform. Get everything you need to monitor performance, functionality, and uptime, starting from:
Streaming Media: It monitors the video or audio streaming services for errors, availability, and performance. FTP Server: It monitors protocols, such as the ability to log in, the existence of a directory, and server availability. DNS: It monitors DNS availability and performance to know the connectivity to the website. Email Server: It verifies the availability and functionality of the SMTP, POP3/IMAP4 email servers, and exchange along with DNS blocklist monitoring. VoIP: It monitors and verifies phone numbers and SIP service availability. Network: It monitors the response time and availability of network ports and protocols, such as UDP, TCP Port/Telnet, ICMP Ping, and traceroute.
Dotcom-Monitor places various monitoring agents across the globe so that you will get immediate notifications and diagnostics if an error occurs. You can set custom alerts according to your business setup and configure your alert groups to immediately inform the team when some changes occur. Give your team the data they need to solve the issue instantly to maximize the server’s performance. You can find monitoring reports to verify third-party vendors’ performance. Start your journey at $35.95/month and get DNS, FTP, DNS Blacklist, 1-180min check frequency, 30 locations, etc. Avail yourself of a 30-day free trial.
New Relic
Monitoring the entire infrastructure is easy with New Relic. Not just it offers Windows or Linux server monitoring but pretty much everything you need to monitor the entire application, infrastructure, network, serverless, etc. It is simple yet robust and affordable, so you can easily scale whenever you need it. New Relic offers to monitor for both in-house and cloud servers like AWS, Google Cloud, DigitalOcean, and Microsoft Azure. Monitor application metrics for MySQL database, log files, Apache server, custom scripts, OS processes, swap usage, Windows services, JVM, Active Directory, and Windows event logs. Perform internal and external monitoring via protocols like ICMP, SSH, TCP, SMTP/SMTPs, FTP, HTTP/HTTPS, POP3/POP3s, and IMAP/IMAP. Track network metrics like ping, packet loss, SNMP devices, jitter, latency, and network interfaces. New Relic offers customizable Slack and email alerts and techniques to remove false alerts. You can configure alerts based on problem severity, status change rules, component dependencies, error and warning thresholds, and staff member responsibilities. Build dependency charts to show a correlation between network devices, servers, databases, and more components. You can create a dashboard to visualize your complete data the way you like it. You can get it started for FREE.
CloudStats
You can also monitor the resources of a Windows or Linux based dedicated server or cloud server. It monitors your site URL along with the expiry dates of your SSL certificates and alerts on detecting any issue. CloudStats allows you to configure alerts based on your requirements and enables you to send those alerts to your team members as well. You get a user-friendly dashboard with clear navigation and color combinations to visualize things in one go. Don’t worry about data security; CloudStats leverages a safe SSL connection to send data securely to a monitoring system. They have pricing plans available for small and medium-sized businesses to enterprises as well.
Server Density
Get a proactive monitoring solution for your infrastructure, including cloud servers, websites, and containers from Server Density, a company by StackPath. It’s clear dashboard shows key metrics and graphs to give you a better idea about the monitoring statistics. As a result, you can diagnose problems quickly without affecting downtimes. This solution is easy and quick to set up and cross-platform compatible for Windows, Linux, Kubernetes, Docker, Mac, and FreeBSD. Server Density also supports the installation of automatic agents via its API and integration with Ansible, Chef, SaltStack, and Puppet. Integrate ServerDensity with 100+ solutions, including MongoDB, MySQL, Varnish Cache, Redis, Elasticsearch, Nginx, HAProxy, Apache, Kafka, Hadoop HDFS, etc. You can trigger alerts over data sent to them through their agent, SNMP, API, or statsd. Interestingly, you can integrate it with Docker and Kubernetes to perform container cluster monitoring. It even alerts you on detecting errors with matching complex numbers and strings. With Server Density, you can wait or delay options to make sure alerts are real or automate the alert management. Get alerts on various mediums, including SMS, Slack, emails, Pagerduty, or webhooks.
Grafana Cloud
The composable observability solution – Grafana Cloud leverages top open-source software like Prometheus, Tempo, and Loki and integrates logs and metrics with Grafana. It saves you from the hassles of installing, scaling, and maintaining your entire observability stack. It features beautiful graphs, valuable alerts, and insightful logs within minutes. Just choose the monitoring service, install a Prometheus-inspired agent, get configured dashboards and alerts, and visualize the metrics. Grafana Cloud offers multiple options to store, collect, visualize, and view alerts on your data. It includes full-stack monitoring for teams looking for a comprehensive solution and needing to set up and start running quickly. You can also choose to Bring Your Own Data (BYOD) method if your team already runs Prometheus, Graphite, or Loki but need a centralized view on different instances, long-term storage, and better query performance. Grafana Cloud is designed using the latest distributed systems and techniques that scale with your infrastructure and applications. It involves no artificial limitations, just the actual horizontal scalability. As a result, you can easily scale beyond 100M+ metrics, avail 30-days log retention, and 13 months of metric retention, which is useful for capacity planning and trend analysis. Their team helps you decrease operational overhead by maintaining and managing your services, including automatic upgrades, guaranteed platform availability, scalability, 24×7 call support, backups, and security patches. Using the Grafana instance from the Cloud Stack, you can fetch data from 60+ data sources to visualize using the same interface. These sources include GitHub, Snowflake, Zabbix, Elasticsearch, Graph, Graphite, MySQL, PostgreSQL, Prometheus, AJAX, Azure Monitor, Datadog, Dynatrace, Google Sheets, JIRA, JSON, New Relic, Redis, and a lot more. Besides, Grafana Cloud has a free plan with 10k series for Graphite or Prometheus metrics, 50GB logs, 14-day retention for logs and metrics, and allows up to 3 users. You can also upgrade to Pro after a 14-day free trial. They offer complete transparency on monthly usage and estimated bills with a detailed report whenever you require it. Get billing alerts to remain notified when your usage changes.
Conclusion
There has been a rise in cloud technology over the last couple of years, and it’s good. It has made our lives easier and has given businesses hope to carry on their operations even in the tough times. Still, you must not forget to perform server monitoring. You have many options available to choose a cloud server monitoring solution, as explained in this article. Thus, go ahead and monitor your server for good. Still need a self-hosted solution? Sure, check out these light-weight monitoring solutions.
![]()
![]()


![]()
![]()
![]()
![]()

![]()


![]()
![]()
![]()

