Even worse is the case of one or more sub-systems failing and the technical team not being aware of it. In critical industries like banking, stock trading, etc., downtime can cost millions of dollars (or more) every minute, while in others, there can be fatal customer backlash. It’s almost come to a point where getting to know an error before your customer does is not just smart anymore; it’s mandatory.
APIs, APIs, everywhere
It’s a world dominated by APIs, and you likely hear and use the term several times a day. If you’re a service provider of any sort, you have APIs that others rely on, and there are APIs that you consume to keep the business running (Google Maps API, SERP APIs, etc.). But this is just the tip of the iceberg. To those in the computer programming world, an Application Programming Interface (API) is a broad term that covers more than just maps and purchases. Without your realizing, everything in a software system (yes, literally everything) is an API or exposes an API. Before we jump on to monitoring APIs, let’s take a moment to understand what an API is and what expanse of our software system it covers. That will help you cut down on choices and better decide which APIs you want to cover and, therefore, which tools will be better for your unique use case.
What is an API?
Let’s begin with the standard textbook definition before we drill deeper using everyday business vocabulary. If we ask Wikipedia about APIs, it has the following to say: The second line is essential (emphasis is mine). It’s not just web services that count as APIs. Operating system calls, database system interactions, hardware signals, software libraries (code that other code can reuse) all fall into the ambit of an API as they all present a well-defined, well-understood interface and set of protocols. An API may be for a web-based system, operating system, database system, computer hardware, or software library. Now, on any given day, any of these APIs can stop working. Maybe the hard disk reached its limit of input/output operations per second, or the SSL certificate expired, or there’s an unspotted bug in the latest version of code being used — all these situations warrant constant monitoring and immediate action when (preferably before) the problem occurs. Appropriately, this article will suggest tools that can monitor your application in all the areas, not just data exchange between two systems.
The cost of API downtime
It’s hard to quantify how much downtime hurts, but Gartner released a study, which pegged the number at $300,000 per hour. This is a modest average, of course. Consider the business loss caused by an hour of downtime during, say, Black Friday discount season. For more horror stories of how malfunctioning/non-functioning APIs killed business or employee spirit, see here and here. While the business side of API downtime cannot be understated, there’s also a hidden loss that might be even greater in the long run — team morale. Developers love automation and reliability in systems (actually, we all do; imagine your mail server going down several times a day!), and downtimes break their code and frustrate them. If these persist, the problems will soon start affecting other business functions (sales and marketing) who will get tired of continually losing face in front of the customer. I’ve closely seen two businesses die a near-death because of poor in-house monitoring systems, and I don’t have the heart to see it again. 😐 Now, downtimes cannot be eliminated; in the real world, anything can go wrong at any time. But by having appropriate monitoring systems in place, we can get to know the errors as they happen, sometimes even before the customer does! With that in mind, let’s look at some of the best API monitoring tools in the market.
Uptrends
A complete solution for all kinds of API monitoring (remember our broad definition of an API from earlier?), Uptrends provides monitoring for websites, APIs, servers, and more. It touts a happy customer base of 25,000, with names such as Vimeo, Microsoft, Volkswagen and more, among its clients. One unique feature of Uptrends is browser-based testing. The service spins up actual different browsers to run your app/website and provides a detailed metric on how it performs. But response times and metrics are only half the story. Uptrends also give you a detailed, asset-wise performance report, so you know exactly what’s causing a bottleneck where. When an error is encountered, the service takes a screenshot and sends it to you, so you can see exactly how it feels on the other end of the equation. 🙂 All in all, Uptrends is a reliable and delightful service trusted by many big names.
Dotcom-Monitor
The Dotcom-Monitor platform allows you to configure a multi-task monitor device using an HTTP/S task. With that, you can monitor OAuth 2.0-based web APIs for availability, performance, and proper responses. By replicating one or more end-client requests and monitoring a SOAP web service, Dotcom-Monitor agents verify that data can be properly exchanged between the API and a web application. When an agent detects an error, it checks it against the device’s filter. If the error is not filtered out, the device fires an alert. You can configure multiple alert groups and set up customized alert schedules and escalation options. Reports are available in CSV, PDF, and TXT formats. They show multiple and useful metrics, such as response times, downtime, and average performance by location. Dotcom-Monitor pricing plans start at $1.99 per month and offer web service monitoring with support for HTTP/S, Web API SOAP/REST, SSL certification check, response validation, instant alerts, and 30 monitoring locations, among other features.
Checkly
Checkly claims to be a state-of-the-art monitoring and testing solution that caught a lot of attention, especially in the JavaScript community with customers such as Vercel and Humio. You can monitor web APIs, as well as site transactions, flows in a real browser. The single dashboard shows you everything you need to know about the correctness and performance of your app at any time. I really like how Checkly combines effortless setup and ease of use with powerful tools to customize your checks. Instead of a simple ping, it uses full-fledged configurable HTTP checks to monitor APIs. This also includes setup/teardown scripts, which comes very handy when you, for example, want to sign requests or clean up test data. Another thing that stands out is the powerful REST API that lets you orchestrate and automate your checks, for example, with Terraform. It also enables users to set up fine-grained alerting in combination with Opsgenie, Pagerduty, or Slack. All-in-all a great solution I see most interesting for modern DevOps teams. Checkly offers a free plan for developers including a 1-minute check interval and global data center locations.
Better Uptime
Better Uptime is a modern monitoring service that combines API, ping and uptime monitoring, incident management, and status pages into a single beautifully designed product. The setup takes 3 minutes. After that, you get a call, email, or Slack alert, whenever your API endpoint doesn’t work correctly. The main features are:
API, Ping, HTTP(s), SSL & TLD expiration, Cron jobs checks Unlimited phone call alerts Easy on-call scheduling Screenshots & error logs of incidents Slack, Teams, Heroku, AWS, and 100+ other integrations
Sematext
Sematext is now quite well-known among DevOps teams thanks to its suite of monitoring tools designed to ensure end-to-end visibility into applications and websites. API monitoring is a part of their synthetic monitoring service, Sematext Synthetics. Sematext offers an advanced API monitoring notification system that you can customize to work on several different conditions based on errors and metrics. That way, you can set up the tool to do a double or triple-check before sending an alert. You basically eliminate false positives in the process and get more accurate alerts and avoid alert fatigue. Further, besides the simple yet powerful HTTP monitor that you’d expect in a good synthetic monitoring and testing tool, Sematext stands out with its comprehensive browser monitor, which enables you to collect web performance metrics and continuously test critical user journeys on your site based on scripted user interactions with the website. This means that you can test beyond the page load times, go deeper, and look at detailed simulated user interactions with the website like login and registration, add to cart and run search queries on the site. A number of common user interactions are provided out of the box. If you have infrastructure on AWS, CloudWatch cannot be recommended enough. Besides application monitoring, CloudWatch also has infrastructure monitoring, helping your DevOps team sleep peacefully at night. As per the official description, CloudWatch offers:
Application monitoring System-wide visibility Resource optimization Unified operational health
So, as long as you have an AWS-only deployment, CloudWatch will be able to monitor your application uptime, performance, resource usage, network bandwidth, disk/CPU usage, and so on, providing a robust solution to all sorts of monitoring. Perhaps the most significant advantage with CloudWatch is that you virtually don’t need to set anything up. The AWS services generate relevant logs and share them directly with CloudWatch, which ends up on a neat and simple-to-understand dashboard. From the dashboard, you can not only read metrics (while the free plans offer up to one-minute accuracy, paid plans can get you as close as one-second accuracy, effectively allowing you to monitor in real-time) but also create custom rules, set up alarms, and when they should trip, scan system logs in as many details as you wish, and more. Sure, not everyone is on AWS, but most critical and famous digital businesses are, which is why I thought CloudWatch should be introduced in this list. I may begin to sound like a broken horn at this point, but honestly, if you’re on AWS, there’s just no easier way to set up monitoring than CloudWatch. Want to learn about AWS CloudWatch, learn from the expert here. But above all, have a look at the free-tier offering and tell me it’s not possible to go for this service. 🙂
Rigor
If you live by performance metrics and put the customer experience above everything else, Rigor is worth a look. The name is well-chosen, as you can get as rigorous with the tool as you want. 🙂 One of the most useful features of Rigor is functional testing. If you’re not into the testing lingo, don’t worry; functional testing refers to the act of testing the entire flow of a transaction, and not just focus on a single endpoint. In some ways, functional testing is more important than unit testing because it implicitly covers unit testing and provides customer experience prediction directly. As you can see in the image above, this functional test has a series of seven rules that constitute a transaction. Rule #1 is a request to search for a particular artist in the API; then, Rule #2 is an assertion, meaning we want to enforce that the artist we searched for is available; if these two tests are passed, the system moves on to Rule #3, and so on. In the example above, the functional test breaks at Rule #7, and stakeholders are immediately notified that there aren’t enough copies of the album “Funky Kingston.” Talk about focusing on business than worrying about technology pieces! Rigor is a severe service for serious business that doesn’t mind paying a premium for something amazing, so if you’re one, definitely check it out.
Assertible
Assertible brands itself as the easiest API monitoring tool and is primarily geared towards Testing and QA teams. So if you think you don’t have the in-house technical competence to wrestle with JSON, XML, and writing code, Assertible is worth a look. The USP of Assertible is engaging and straightforward: Your QA and Testing teams can create tests and verify/monitor them using the Assertible interface. It integrates perfectly with GitHub, so your knowledge base stays with you, besides working seamlessly with Slack. The full-circle integration and review functionality allows virtually anyone in your team (even project managers) to create tests and review performance metrics. Okay, the situation in the screenshot above might seem a bit unrealistic (one-minute issue-resolution), but it’s possible when feedback is clear and immediate. The zero absence of coding required means that tests can be created as quickly as your QA teams can type, and once done, can be applied over and over again. This is in stark contrast to the practice of “manual testing” followed at most companies, where a single tester can take several days to cover the app, and yet miss out on more excellent details simply due to oversight or exertion. For as little as $100 a month (which is their top plan, by the way), Assertible allows you to monitor as many as 50 web services, a total of 50,000 tests, and 20 team members. Consider the cost of having a QA working full-time to create and manually run through tests, and it’s obvious that Assertible offers exponential efficiency.
BlazeMeter
When it comes to end-to-end testing and monitoring of applications, BlazeMeter is the behemoth that eats everything else for lunch. At the same time, though, it’s not for the faint of heart or those looking for a simple API monitoring solution that doesn’t demand much. BlazeMeter is something you get married to, and then it keeps paying off over the lifetime of the app. The biggest plus point of BlazeMeter is integration with Apache JMeter, arguably the default performance measurement tool for large web applications. Yes, with BlazeMeter, you are free to choose open source testing frameworks and analyze them easily via simple dashboards. The plans are pricey, and if your application can see up to 5,000 concurrent users, it’s going to cost you $649 per month to use BlazeMeter. Fixed costs plans are available for even larger workloads, which the norm given the kind of clients BlazeMeter has: Pfizer, Adobe, GAP, NFL, Atlassian, to name a few. It’s not as if BlazeMeter cannot be used in simpler ways. Like most other API monitoring tools, it does provide functional testing (they call them “scenarios”), which can be done using an intuitive GUI front-end. That said, BlazeMeter is built for developers. Through it’s dedicated testing tool Taurus, BlazeMeter exposes a DSL (Domain Specific Language) that can be used to write generic tests that can be run against JMeter, Selenium, and other popular open-source tools. And don’t let the mention of a DSL worry you; it’s nothing more than a glorified YAML (.yml extension) file: Spend some time with Taurus, and your developers will be thankful for being able to write intricate, reusable tests! All in all, BlazeMeter is a heavyweight for the heavyweights.
AppDynamics
Now a part of Cisco, AppDynamics has been in the web application monitoring game for a long time and is quite well-known. At present, AppDynamics is a suite of tools to solve a broad range of performance and monitoring requirements of a modern SaaS team. As far as pure API/microservice monitoring goes, the suite offers Microservice IQ. With this service, you can monitor and analyze a microservice cluster of virtually any scale, preserving the history and letting you correlate it with changes in the cluster. At any rate, this at least allows you to simulate the impact of adding/removing nodes from the cluster. The same goes for monitoring real-time metrics, which can be done at a cluster-level or node-level, presenting you both the big-picture view and the extreme detail, as needed. As you can see in the screenshot, Docker monitoring is built right in, which will be appreciated by teams with their infrastructure running on Docker (almost everyone, that is 🙂 ). The icing on the cake is the integration of Machine Learning into the very heart of the system. For instance, sometimes you don’t know the ideal baseline for your app, but since the business is running smoothly, you can accept the current metrics as a baseline. So, how do you go about calculating the baseline? It’s hard when you have thousands of data points streaming in every hour, but not if there’s a capable machine learning system running. How does this help businesses? Here’s an example. If you know your baseline for uptime is 98.5%, and you’re currently running at 98.6%, you can have real peace of mind. Besides, having access to real, hard baselines saves you from over-engineering and expensive migrations that some consultants might recommend to push for “six nines” (99.9999% uptime). The ML system is also intelligent enough to figure out and report the single cause of failure among a cluster of microservices from inside the code (that’s the most impressive part!), so your teams know exactly what to fix. The screenshot below shows how the system can drill down into a Java Spring-based REST service and point to the Bean that failed. It’s not possible to cover all the jaw-dropping features here, so feel free to check out the official docs.
New Relic
According to many, New Relic is the market leader in application performance monitoring tools, and for a good reason. It’s used by large and small companies alike — from Fortune 500 behemoths to small, nimble startups — and offers a great combination of precision and detail. The New Relic team prides itself on its deep understanding of DevOps, and so accordingly, this offering is built to provide a complete, real-time view of your infrastructure. The biggest USP of New Relic is the intuitive layout of the entire system, which lets you instantly see how everything is flowing and exactly where the bottleneck, if any, is. It’s hard to describe the UI in words, so here’s a screenshot: As you can see, it’s pretty easy to visually trace how data is flowing from system to system and the resulting performance metrics there. Sluggishness and downtimes trigger instant alerts, allowing them to fix the problems before the business suffers. It’s not just the DevOps side that is covered in New Relic. It’s also possible to set goals and rules for customer experience and get detailed reports to figure out where more work is required. As any digital marketer worth his salt knows, this information is solid gold. There’s no end to the ingenious dashboard at New Relic. Take a look at this one, for example, which maps out the entire application cluster by nodes, and provides live feedback on what’s happening at each node. So, whether your application is simple or complex, New Relic can offer a lot of interesting insights.
API Fortress
Next in line is API Fortress, which aims to be a Swiss-army-knife of API monitoring for various teams in an organization, and does it pretty well. Aimed at both testers and developers, API Fortress allows the creation of visual, collaborative tests like any other modern API monitoring tool out there, and then walk a little more distance regarding convenience and features. The two I like most are Load Testing and Mocking. For developers, API Fortress can create a test suite from a given API specification. So, if you follow Swagger, OpenAPI, or RAML, half of the work is already done. API Mocking allows your dev teams to define the interface of the new API as a mock service, upon which the QA teams can start building the test suites immediately. No more tiring, long waits for the actual API to finish before QA can get started! API Fortress also works with all major CI/CD systems, alleviating one more pain point of integration. Finally, rock-solid load testing and monitoring are also built-in, making API Fortress a complete package for development and testing teams for rapidly testing and monitoring APIs.
API Science
With API Science, you get to test your APIs with an API. Although that does sound like a fancy way of saying the same thing, API Science does come with a few novel features that are likely to appeal to many. The first one is full-stack monitoring of your API stack, which means covering external APIs as well. It happens many times that your APIs are performant and responsive, but the ones your business depends on are down. Also, in some cases, there isn’t any objective ground claim which API was down at which time, a struggle that can turn into a sort of cold war between two API providers. In such cases, API Science works as an indisputable middle ground that can show the historical availability of APIs. The second cool feature is the distributed testing of APIs. API Science monitors your APIs from several locations across the globe and lets you know how the API is behaving for different locations. Combine all this custom JavaScript in your monitoring system, and you have a near-ideal API monitoring tool. 🙂
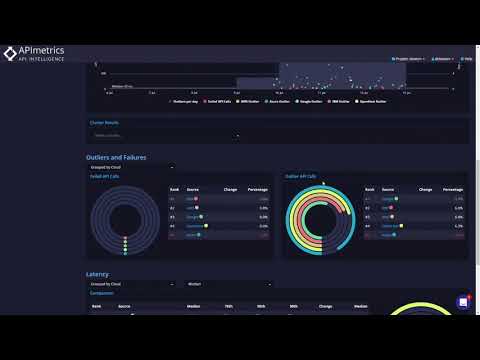
APImetrics
With full end-to-end coverage, APImetrics’s API monitoring does a fantastic job of letting you know of issues even before they’re reported by your users. You can monitor from over 80 different locations and get real-time alerts straight to your preferred tool, which includes email, Slack, Pager Duty, and other similar ones. Other than that, it lets you look through the API functioning, whether it’s DNS lookup or processing times of the server in order to confirm that transactions are completed as they should be. This is a pretty handy feature, and given that APImetrics is super simple to set up in general, makes things even better. This service can handle any type of API requests, set conditions, define assertions and give you insights for various areas, including connectivity issues.
Moesif
Moesif is a highly user-centric tool that tracks user experience on your APIs. It lets you track API issues that are impacting customers and take proactive action to fix them. The ‘alert rules’ feature lets you track various metrics and alert you whenever a threshold is breached, for example, a sudden surge in the number of site visitors or a spike in CPU utilization. You can integrate this tool with collaboration tools such as Slack to get alerted at a team level. The ‘user notification’ feature gives you the list of customers or visitors who have used your API and their behavior, which can help you in marketing, retargeting, and customer retention. You can also integrate Moesif with CRM tools like Hubspot and Salesforce to reinforce your marketing automation. The tool offers multiple prebuilt team dashboards for different projects or departments to focus on what’s important to them. Moesif offers a free trial for 14 days and paid plans start at $85 per month.
Conclusion
With that, my top recommendations for API monitoring come to an end. I did my best not to restrict APIs to the narrow definition they get labeled with most of the time. Right from business owners to developers, testers, QA, and project managers, there are tools in this list that work for everyone. Next, find out how to secure APIs.
![]()
![]()


![]()
![]()
![]()
![]()

![]()


![]()
![]()
![]()

