Charting libraries are becoming increasingly popular. Small development teams can build full-functional financial apps with technical data visualizations simply by importing the library codes. Read on to learn more about financial charting libraries, standard features, and some popular names in the market.
What Are Financial Charting Libraries?
Financial charting libraries are ready-made scripts that you can integrate with your mobile or web app using the front-end and back-end frameworks. Then, you can use APIs for various market data like equities, futures, bonds, commodities, forex, and cryptocurrencies to feed the data set to the charting library. Using GPU or WebGL rendering, your app can visualize pixel-perfect and professional technical; charts like candlesticks, scatterplot, Heikin-Ashi, etc. The purpose of such libraries is to reduce the development workload and release apps to the market faster. If you start building charting interfaces from scratch, you will need to hire developers who are experts in graphs, mathematics, and financial data analysis. You can save costs by just buying a charting library.
Must-Have Features of Charting Libraries
Charting libraries should offer maximum support for various front-end and back-end development frameworks.If you want to release your stock or cryptocurrency market app globally, go for libraries offering multiple foreign language integrations.The charting libraries should also have multiple rendering options for the visual interface and financial data. For example, the tool should support both WebGL and GPU rendering.Annotations are an indispensable feature for any financial charting library. Investors and traders would like to conduct post-trading analysis and reporting. For these purposes, an annotation toolbar should be available.The charting code library must offer standard financial chart types like Line, Point & Figure, Candlestick, Heikin Ashi, etc. Choose charting libraries that provide multiple viewing options for financial data. For example, zooming, right-click menu, panning, chart scroll, grid view, etc.
Now, find below some useful HTML5 charting libraries and JavaScript libraries that you can use:
DXcharts
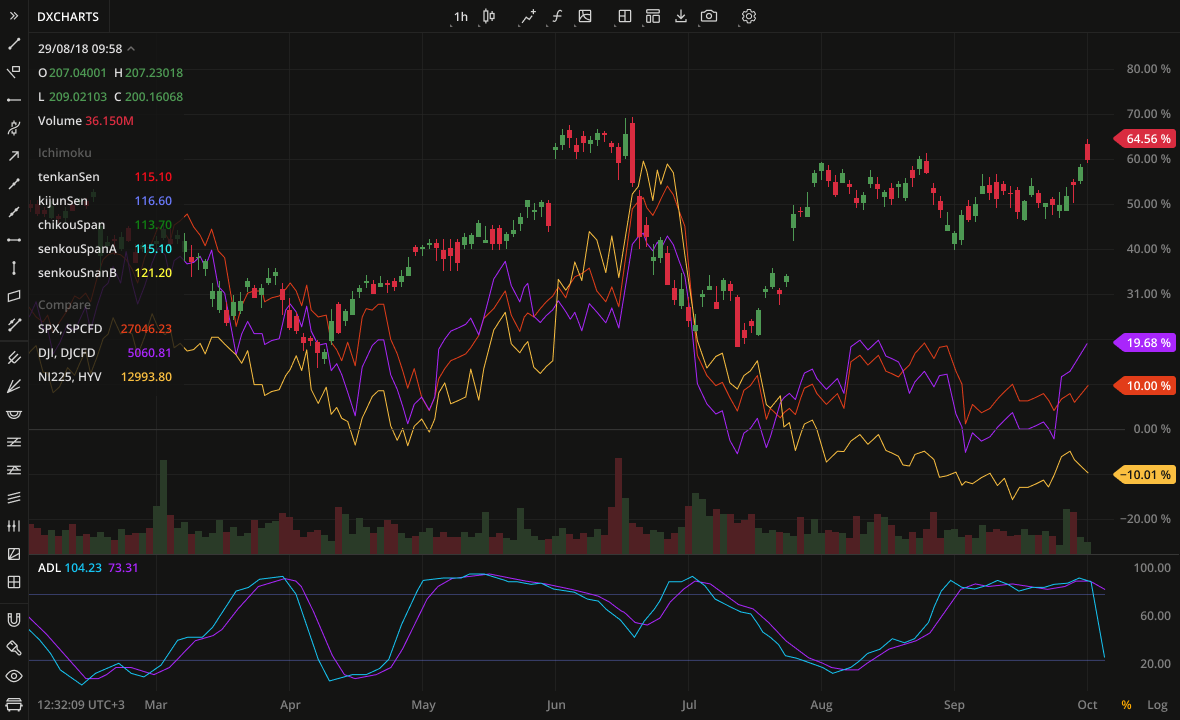
DXcharts from Devexperts is a modern-looking and advanced HTML5 charting library. It is suitable if you want to develop a mobile or web app for financial trading in the stock, forex, commodities, and cryptocurrency markets. If you want to give your app users multiple ways to read financial data, you need to try out this ready-to-use charting library. Embedding the DXcharts widget into a news website is a matter of several minutes, and you don’t even need an experienced developer to do this. The DXcharts library provides multiple widely used charts in the financial sector. For example:
CandlesticksHeikin-AshiHistogramRange or PointsEquivolumeVolume CandlesScatterplotLineBarArea
DXcharts has the biggest number of drawings – 42, so traders can draw their trend lines, support levels, and shapes, add notes, and select from over 100 indicators. Actually, the number of indicators is unlimited, because Devexperts embedded its own simple programming language dxScript into DXcharts. This allows users to create any type of indicator without prior coding experience. The library also comes with multiple chart layouts (like the grid), with the ability to sync them by symbol, aggregation, date range, appearance, and indicators. Among other notable features to engage users are instant screen capture and social sharing to Twitter, Telegram, and other social media groups and profiles. Also, you are free to place your logo and brand colors in the DXcharts library and widget, while viewing equities, futures, crypto, indices, forex, and other data sourced from dxFeed, a Devexperts’s data division. By the way, according to our research, DXcharts seems to be the only financial charting library with market data out of the box on the market. Last but not least: DXcharts complies with the accessibility guidelines and supports keyboard-only navigation, which is convenient for people with reduced ability to use hands and fingers.
TradingView
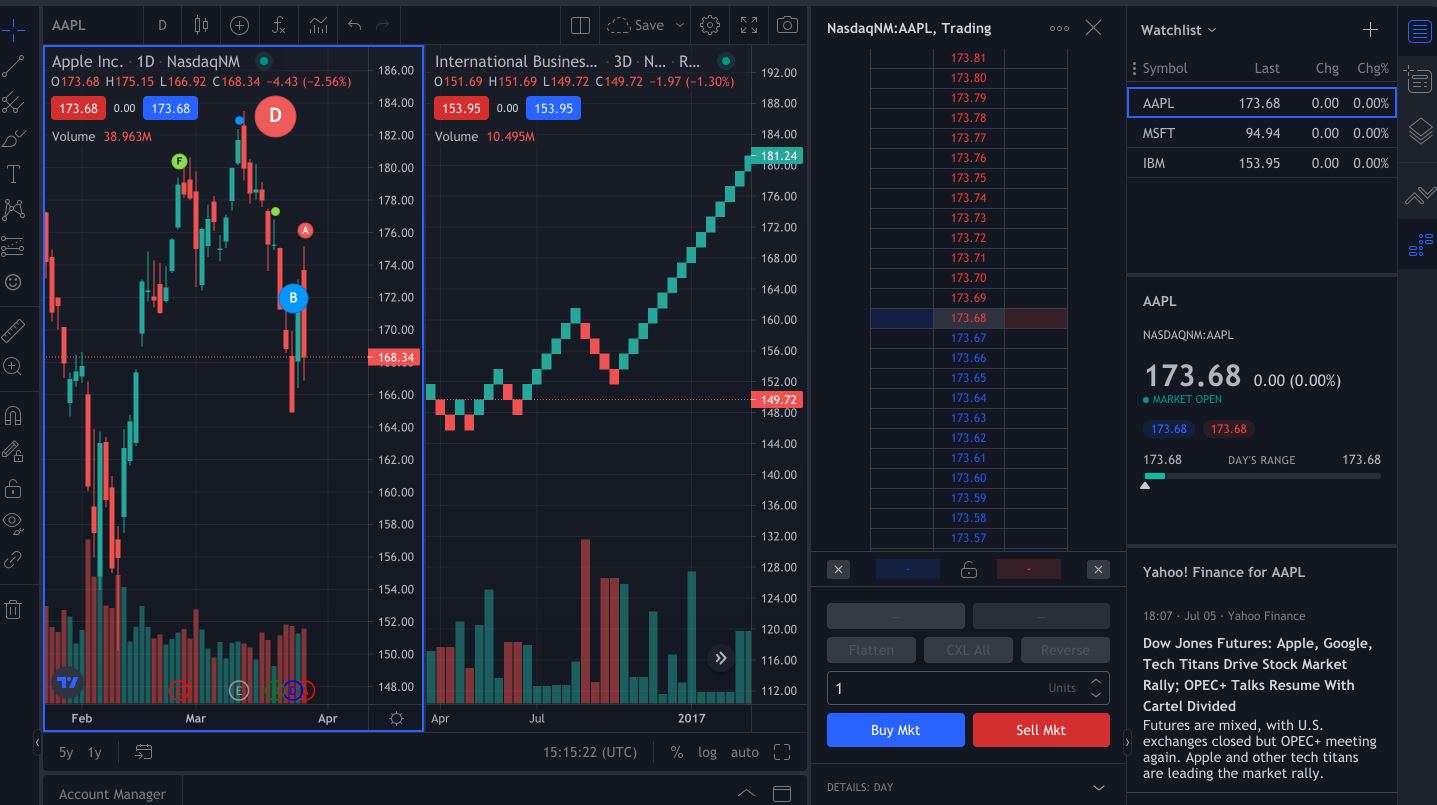
TradingView is yet another popular destination for financial HTML5 charting libraries and widgets. These charts power your users to do informed trading via asset analysis. Also, the charting libraries and widgets are developer-friendly. Hence, implementation takes only a few hours. TradingView offers you Self-hosted libraries and Cloud widgets. If your team consists of expert developers and you want highly customizable financial charting, you can go for Self-hosted libraries. On the contrary, if your team is small and you do not yet have an experienced developer who can integrate HTML5 libraries, you can opt for the Cloud widgets for all sorts of charting needs. Self-hosted libraries again come in three variants: lightweight Charts, Technical Analysis Charts, and Charting & Trading platforms. However, Cloud widgets come in Lightweight Charts and Technical Analysis Charts. TradingView uses HTML5 Canvas technology for all of its charting libraries. It ensures that your financial charts will always look perfect and native on devices of any screen size.
Cosaic
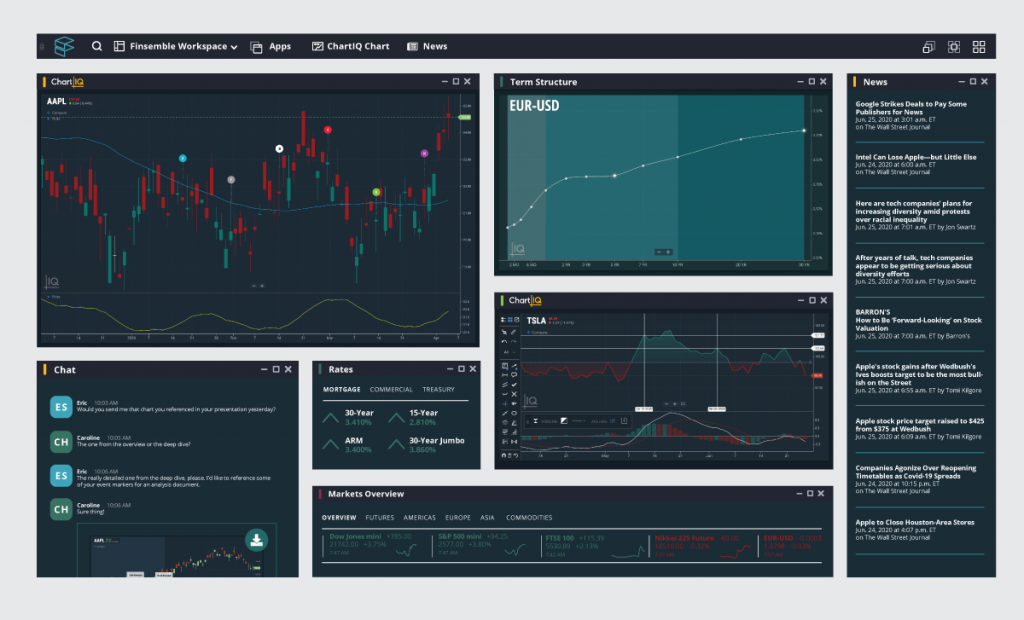
Give your financial app users the power to analyze asset classes and make an informed investment decision with Cosaic. With these easy integrating HTML5 charting libraries, your users get a competitive edge over their competitors. Your development team can integrate the HTML5 canvas-based charts in your app, third-party apps, educational apps, and any other web/mobile apps that deal with financial data analysis. Its premium charting modules are:
Active Trader plus Trade from Chart for time series charts, especially for regular traders.Post-Trade Visualization module to fully visualize an order life cycle after the trade.Term Structure Graph is for fixed income traders who deal in currency, commodities, and bonds.
Cosaic’s charting assets are one of the best in the market and highly professional. The HTML5 charting library system is compatible with most devices like smartphones, tablets, desktops, and web browsers. The library also efficiently integrates with most app development frameworks like React, Angular, etc.
AnyChart
AnyChart is a robust and lightweight JavaScript charting library. It comes with great documentation, enterprise-grade support, and APIs. It has been available commercially since 2003 to enable developers to integrate professional financial charts on desktop, web, and mobile apps. The JavaScript library is compatible with most platforms and financial databases. To support users from all the sections of the society, the charting library also supports Section 508 requirements for accessibility settings. First off, the charting library lets you display up to 68 chart types out of the box. It also provisions custom chart drawing functionalities so your users can create their charts. Some of the popular charts that you will get are:
Bullet ChartArea ChartBar Mekko ChartCandlestick ChartDot/Marker ChartHorizontal GaugeJump Line ChartError Chart
Moreover, the charting library also offers features like big data analytics, annotations, drawing tools, technical indicators, and local language implementation.
Barchart Solutions
Customers prefer those apps that offer detailed charting in different forms and views for advanced asset trading. You can use this customer choice by getting interactive HTML5 charting libraries from Barchart Solutions. Financial charts and the modification capabilities of your investment app drive customer acquisition, user activation, and consumer conversion. It offers raw HTML5 Canvas Technology-based charting libraries for companies with a great team of developers. Key features that you can expect are:
100+ technical indicators More than 20 annotations10+ different plot typesCompatible with the entire Barchart ecosystem
You can host the charting functionalities on your server. Also, you can feed the charts with your data or get market data from Barchart Solutions.
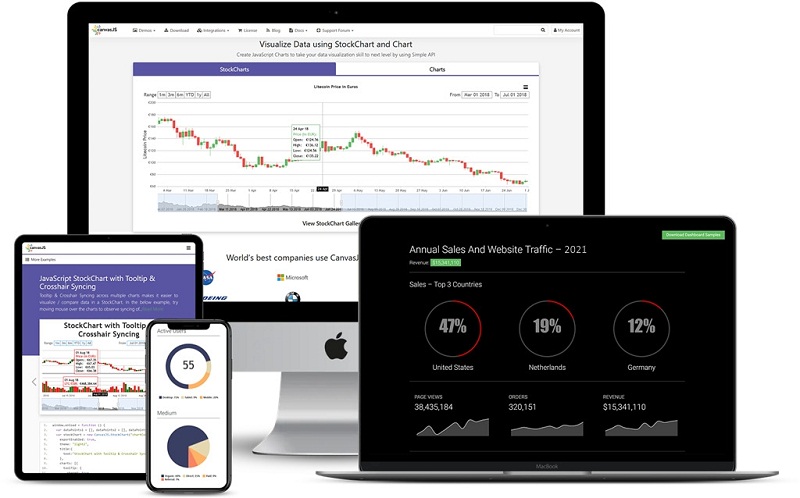
canvasJS
canvasJS offers you JavaScript Stock Chart Library with Simple API and ten times faster performance. The charting libraries empower you to create stock market and financial investment charts with zooming, panning, and animation at superior performance levels. Furthermore, the JS charting library also supports downloading the stock market, crypto market, and financial charts as image formats on the user side. Also, the library integrates instantly with popular JS frameworks like Angular, React, Vue.js, Ember.js, Meteor, and more. Key library features are:
Multiple chart types like OHLC, Range, Area, Candlestick, Line, Spline, etc.MACD, SMA, EMA, etc., technical indicatorsInteractive and responsive charts using Angular, React, and JQueryPHP, ASP.NET, JSP, and Spring integration
Additionally, canvasJS has programmed these JavaScript charting libraries so that your developers can easily integrate the code with server-side technologies for stock market data linking.
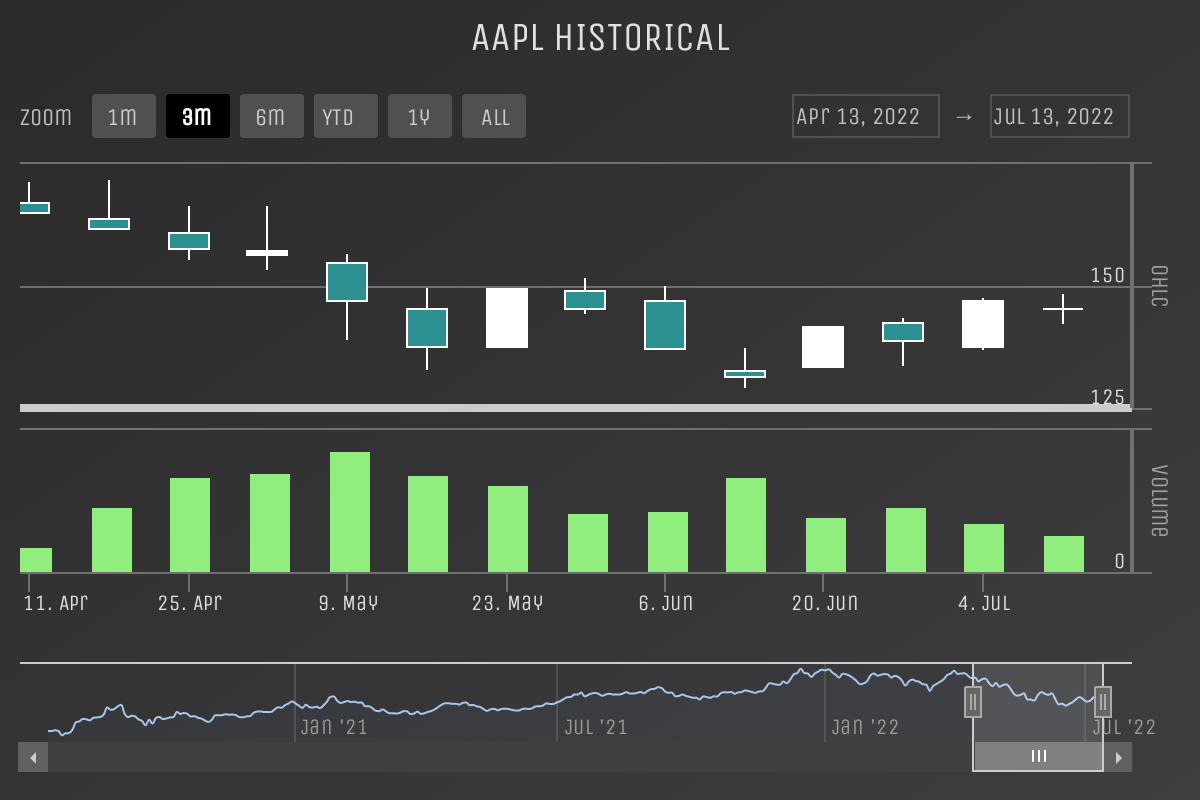
Highcharts Stock
It is yet another leading destination for accessible and responsive charts. Highcharts Stock is dedicated to the financial apps that deal with the stock market, crypto assets, and all other investment products. The charting tool is SVG-based and built on the JavaScript charting libraries from Highcharts. Key data visualizations are:
Single line seriesTwo panes: candlestick and volumeMultiple series comparisonFlags for many events markingCumulative SumIntraday with breaksIntraday candlestick
One of its hot features is 40 technical indicators for traders. These are MACD, SMA, RSI, CCI, Bollinger Bands, PSAR, Pivot Points, and many more. End-user-level statistical analysis, annotation, and reporting are also important for a successful stock market app. It lets your users perform the above tasks from a dedicated toolbar, and no developer help is needed.
FusionCharts Suite
FusionCharts Suite assists you in developing professional and beautiful dashboards for projects like web and smartphone app development. It is easier than ever and intuitive to integrate responsive and interactive charts in your app development projects. FusionCharts Suite provides all the necessary resources like cross-browser support, documentation, and a stable API. The FusionCharts JavaScript financial charting libraries allow your developers to build simple charts like columns, lines, pies, etc. Furthermore, your team can also develop domain-specific visualizations, like stock charts, radar charts, and heatmaps. For front-end integrations, the library supports React, Angular, Vue, Svelte, etc. And for backend integrations, your developers can use Django, Java, PHP, Ruby on rails, etc.
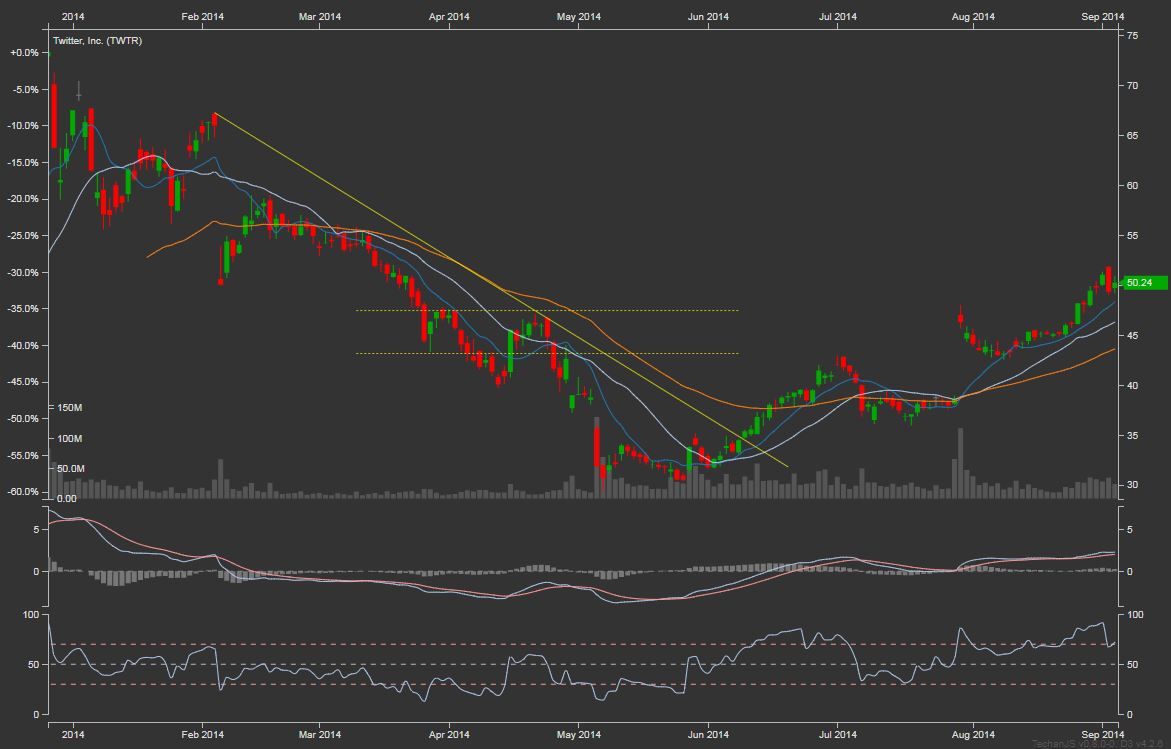
TechanJS
A JavaScript charting library built on D3 (Data-Driven Documents) for creating financial charts for modern browsers that are highly interactive and available on TechanJS. It also offers an application programming interface (API). The API is also primarily based on D3 programming idioms well established in the D3 programming niche. Key data plots that you can get are:
CandlesticksOHLC or open-high-low-closeTime ScaleSVG Arrow PrimitiveTick Spread Plot
Notable indicators that your users can use are:
Average Directional Index (ADX)ATR Trailing StopAverage True Range (ATR)Stochastic OscillatorMACDHeikin-Ashi
When you use this charting library for your financial app data visualization, the charting interface shall feel intuitive, familiar, and non-obtrusive. On top of that, the source for the JS library is free to download from GitHub.
LightningChart
LightningChart offers financial app developers interactive, responsive, and lightning-fast JavaScript charts in 3D and 2D versions. The graphs that you see on the LightningChart platform show superior visual graphics. However, you need WebGL to render these interactive assets on the web or mobile apps. These JS library-based charts can handle large datasets. For example, you can visualize 1.2 billion data points using static heatmaps. On the other hand, you can feed and visualize 10 million data points/second using the real-time heatmap charting library. LightningChart is also a leading destination regarding data analysis and visualization performance. Since the charting libraries can utilize GPU and WebGL, your users get unmatched performance compared to your competitors.
amCharts
amCharts is a well-rounded data visualization charting library based on JavaScript. The charting tool has been built on the flexible and super-fast amCharts five engines. Hence, the tool delivers customizability, performance, and analytical tools for time-based stock market data. First, it offers a standard list of indicators needed for stock trading. There are 15 automated indicators like MACD, Bollinger Bands, Moving Average, etc. Secondly, the charting library enables users to use annotations for post-trade analysis and reporting. Thirdly, there is a comparison tool to convert a chart to percent mode when adding a comparable index.
JSCharting
You can also explore the JavaScript charting library offerings from JSCharting. These ready-to-integrate charting codes are available for both financial and non-financial purposes. Its advanced and modern finance stock market charts are available in different visualizations like:
Open-high-low-close (OHLC)CandlestickMultiple chart areaVolume
Apart from various financial and investment stock types, you also get technical indicators, annotations, and view controls. You can select from any eight stock market chart types from its portal and click Edit to enter the coding interface. You should be able to see the source code of the chart. Though the source code is visible, you need commercial licenses to use the codes in any commercial web or mobile app.
Final Words
So far, you have discovered the ultimate list of Financial Charting Libraries suitable for commercial mobile and web apps. The list showcases code libraries for both HTML5 charting libraries and JavaScript libraries. Depending on your app project, you can take your pick. Your app may also contain a dashboard for a bird’s eye view of the financial portfolio of users. Read on to find the best charting libraries here.
![]()
![]()


![]()
![]()
![]()
![]()

![]()


![]()
![]()
![]()

